Use R, Google Sheets and a nutrition API to calculate a nutrition table

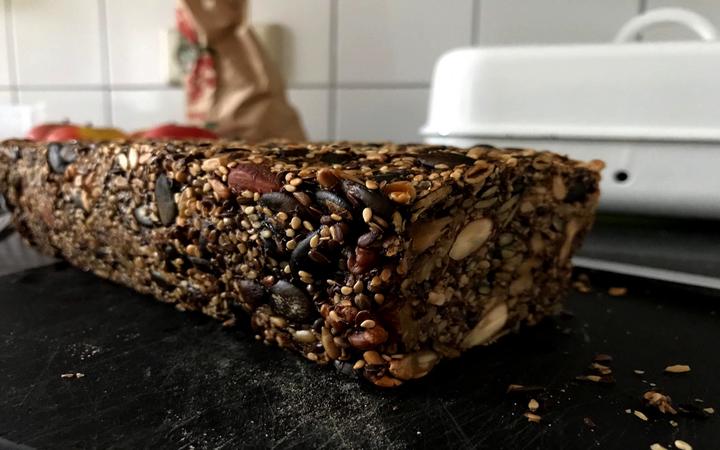
I recently stumbled upon this bread recipe. It’s quickly prepared, the bread tastes great and is full of valuable ingredients (only oats, nuts and seeds). However, being homemade it does not come with a nutrition table. The following shows an easy way to create one.
We put the recipe into a spreadsheet (recipe). Another spreadsheet contains the nutritional values of the macro nutrients of each ingredient (food stats). We combine these using R to get the nutrition table. Then, we look at an alternative to manually creating a spreadsheet with nutritional information by using an online database. As a bonus, we can calculate the price of the recipe.
Downloading Google Sheets to R
A simple way to import Google Sheets to R is the gsheet package. We only need to supply the sharing link. It returns a tibble.
food_stats = gsheet::gsheet2tbl("https://docs.google.com/spreadsheets/d/1qgo8Yefb5nx5PVElZvmf6nSDI6RfN2ofd8CeMuSklHk")

recipe = gsheet::gsheet2tbl("https://docs.google.com/spreadsheets/d/1C0AwjQYrudrV3ZLgQJZnCr9La7OVftRTZn3QKMrJx5E")
food_stats contains more ingredients than we need for our bread recipe.
So when we merge both data frames we only want to keep the rows
that contain the ingredients of the recipe.
This is done by left_join() from the
dplyr package.
library(dplyr)
bread_ingredient_stats = left_join(recipe, food_stats, "Description")
Calculating the nutritional values
We have 10 ingredients. First, we create a vector that gives us the quantity of each ingredient in grams, then we select the columns that are relevant for the nutrition table.
nutrient_names = c("Calories (kcal)", "Total Fat", "Saturated Fat",
  "Total Carbs", "Sugar", "Dietary Fiber", "Protein")
quantities = select(bread_ingredient_stats, "Quantity (gr)")[[1]]
nutrition_values = bread_ingredient_stats %>% select(nutrient_names)
The following calculation gives us the quantity of each macro nutrient in our bread per 100g:
nutrition_table = colSums(nutrition_values * quantities) / sum(quantities)Finally, we can print our nutrition table:
knitr::kable(nutrition_table, digits = 1, col.names = "per 100g",
caption = "Nutrition table")| per 100g | |
|---|---|
| Calories (kcal) | 307.3 |
| Total Fat | 22.5 |
| Saturated Fat | 4.7 |
| Total Carbs | 12.2 |
| Sugar | 0.5 |
| Dietary Fiber | 10.6 |
| Protein | 12.6 |
Calorie-wise very similar to your typical brown bread, but rich in fat. Trust me, the bread is very filling, so you won’t be able to eat too much of it anyways. And how much does it cost?
prices = select(bread_ingredient_stats, "Price (€)")[[1]]
packaging = select(bread_ingredient_stats, "Packaging (g)")[[1]]
(price_total = sum(prices / packaging * quantities, na.rm = TRUE))
## [1] 3.208962One loaf of bread is 3.21€ (not including energy and time) weighing 910 grams (raw ingredients). I think that is a fair price for a bread I can eat from for a whole week.
Using the API of a nutrition database
Instead of manually creating a spreadsheet for the nutritional values of each ingredient we can fetch the information from on online database. We use openfoodfacts. It’s a crowd-sourced database of food stats. To identify a product we need a barcode for each ingredient which I added to the recipe spreadsheet. The openfoodfacts API returns a JSON file which we can convert to a list using the rjson package. We write two helper functions to fetch and extract the relevant information.
library("rjson")
fetch_json = function(barcode, url = "https://world.openfoodfacts.org/api/v0/product/") {
  query = paste0(url, barcode, ".json")
  fromJSON(file = query)
}

extract_nutrition_values = function(food_list,
  nutriments = c("energy_100g", "fat_100g", "saturated-fat_100g",
  "carbohydrates_100g", "sugars_100g", "fiber_100g",
  "proteins_100g")) {
  nv = setNames(rep(0, length(nutriments)), nutriments)
  tmp = unlist(food_list$product$nutriments[nutriments])
  nv[names(tmp)] = tmp
  nv
}

barcodes = bread_ingredient_stats$Barcode[-10] # water does not have a barcode
nutrition_values_api = matrix(0, nrow = 10, ncol = length(nutrition_values),
  dimnames = list(1:10, nutrient_names))
for(i in seq_along(barcodes)) {
  food_list_tmp = fetch_json(barcodes[i])
  nutrition_values_api[i,] = extract_nutrition_values(food_list_tmp)
}
nutrition_values_api has the same structure as nutrition_values from above,
so we can proceed as before:
(nutrition_table_api = colSums(nutrition_values_api * quantities) / sum(quantities))## Calories (kcal) Total Fat Saturated Fat Total Carbs
## 1344.0329670 22.4906593 4.7263736 12.3516484
## Sugar Dietary Fiber Protein
## 0.4923077 8.9291209 12.5313187The results for the macro nutrients differ slightly which is expected because we changed the data source. However, the value for calories quadrupled because the API reported energy in kilojoule (kJ) instead of kilocalories. To correct for this we divide the value by \(4.1858\).
nutrition_table_api[1] = nutrition_table_api[1] / 4.1858
knitr::kable(nutrition_table_api, digits = 1, col.names = "per 100g",
caption = "Nutrition table")| per 100g | |
|---|---|
| Calories (kcal) | 321.1 |
| Total Fat | 22.5 |
| Saturated Fat | 4.7 |
| Total Carbs | 12.4 |
| Sugar | 0.5 |
| Dietary Fiber | 8.9 |
| Protein | 12.5 |
And we are done!